Watchlist


Gold Price Forecast: Bullish at $2345 Amid Fed Rate Hike Speculations and Geopolitical Tensions
Gold’s price stood at $2345.55, with technical indicators pointing to a bullish momentum. In the shadow of a strong U.S. jobs report, with nonfarm payrolls adding 250,000 jobs in April, and Fed officials’ hawkish tones, gold navigates below $2,350.

The Federal Reserve’s signals of a delayed rate cut have buoyed the dollar, with 10-year U.S. Treasury yields reaching a peak of 3.5%, their highest since November. This fiscal environment challenges gold’s advance, typically inversely related to U.S. interest rates and dollar strength.
Geopolitical Uncertainty Fuels Safe-Haven Demand
Amidst floundering ceasefire talks between Israel and Hamas, and Iran’s looming military threats following a supposed strike on its Syrian embassy, gold’s safe-haven appeal strengthens. Such tensions could sustain gold prices above the pivotal $2,300 level, counterbalancing bearish pressures from the economic domain.
Fed Rate Speculations and Gold’s Outlook
Market anticipation of Fed policy adjustments is keen, with odds nearly 50% against a rate hike in June. Investors, poised for the release of U.S. CPI data expected to hover around a 0.3% monthly increase, and FOMC minutes, await cues that might recalibrate gold’s trajectory.
These developments are crucial for investors gauging the balance between rising U.S. fiscal metrics and enduring geopolitical strains impacting the gold market.
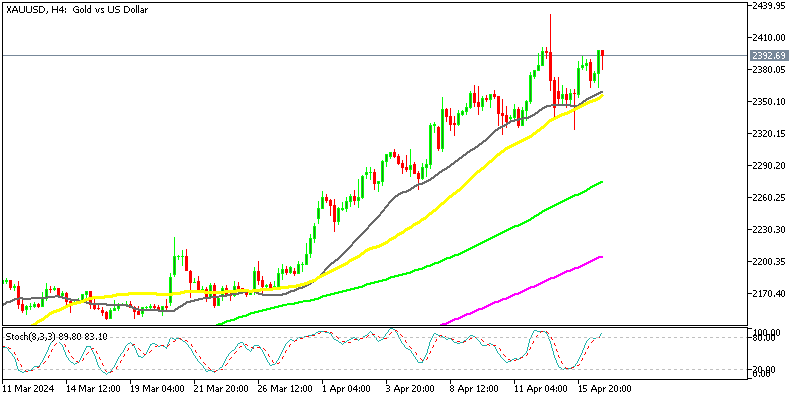
Gold Price Forecast: Technical Outlook
On April 9, Gold’s price stood at $2345.55, with technical indicators pointing to a bullish momentum. The pivotal support is at $2327, a level where the metal shows strength. Resistance is seen at $2369, $2395, and $2419, while support levels are at $2304, $2277, and $2252.
The Relative Strength Index (RSI) of 68 suggests Gold is nearing overbought territory, indicating strong buying interest.
The 50-day Exponential Moving Average (EMA) at $2275 supports the bullish trend, with recent price actions forming a bullish engulfing candle above the pivot point, reinforcing the potential for continued upward movement.
Gold’s price trajectory is bullish above $2327, but a fall below this threshold could lead to a rapid sell-off. Today’s market sentiment and technical patterns suggest Gold is poised for further gains, maintaining a bullish outlook.


🏆 7 Best Forex Brokers
| Broker | Website | |
|---|---|---|
| 🥇 |  | Visit Broker >> |
| 🥈 | Visit Broker >> | |
| 🥉 |  | Visit Broker >> |
| 4 |  | Visit Broker >> |
| 5 |  | Visit Broker >> |
| 6 |  | Visit Broker >> |
| 7 |  | Visit Broker >> |