Today most markets are closed again for Easter, but we had some positive data from China over the weekend, with the manufacturing and services PMI showing decent improvement and leaving behind contraction. Commodity dollars turned bearish for most of March, but it we see more positive numbers from China, indicating an improving economy, then the risk sentiment will improve and commodity dollars such as the AUD and NZD would benefit from this.
AUD/USD Chart Weekly – Sellers Facing the 50 SMA
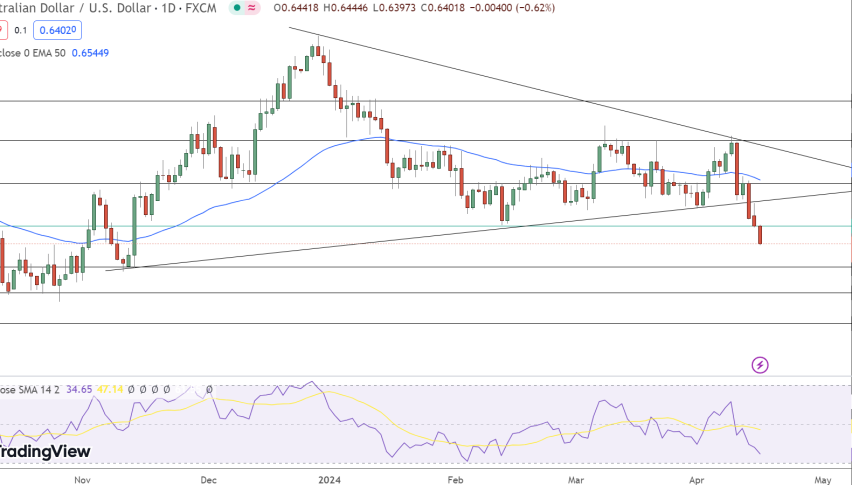
However, we have the other side of the trade to take into account. Last week we saw some positive economic numbers from the US, which helped the Buck and sent both AUD/USD and NZD/USD lower, breaking some important support levels on Thursday. The Aussie fell below the 0.65 level, but sellers weren’t able to keep the price down there, and eventually, it closed the week above 0.6520.
However, moving averages continue to act as resistance, keeping the trend bearish. But the lows have been getting higher as well since October, which indicates a battle between buyers and sellers lately. So, if China manages to get back on track, the Australian economy will benefit and so will the AUD.
NZD/USD Chart Weekly – The Price Remains Below 0.65
NZD/USD also remains bearish. subdued by moving averages which keep pushing the highs lower since September 2020. This forex pair broke below 0.60 level, but unlike the Australian Dollar, it closed the week below this major level. The stochastic indicator here is oversold which indicates a bullish reversal, but we’ll see how the US economy progresses as well, and how the FED will react to it.
China Manufacturing and Services PMI Report for March
- Manufacturing PMI: The March manufacturing PMI came in at 50.8 points, surpassing expectations of 50.1 points. This marks a notable improvement from the February reading of 49.1 points, indicating expansion in the manufacturing sector.
- Services PMI: The services PMI also exceeded expectations, reaching 53.0 points compared to the anticipated 51.5 points. This represents an increase from the February reading of 51.4 points, indicating growth in the services sector.
- Composite PMI: The composite PMI, which combines both manufacturing and services data, stood at 52.7, up from the previous reading of 50.9, reflecting overall expansion across both sectors.
Overall, the March PMI report suggests a positive outlook for China’s economy, with both manufacturing and services sectors showing signs of growth and resilience, with services getting further away from contraction, while manufacturing finally also jumped above contraction levels.
This morning we also had the Caixing manufacturing report, although the official PMI survey includes large and state-owned companies, while the Caixin PMI survey, which focuses on small and medium-sized businesses, both surveys often yield similar findings regarding China’s industrial sector.
The Caixin PMI is considered a more credible indication of the performance of China’s private sector due to its focus on smaller enterprises. Moreover, the Caixin PMI survey typically incorporates a larger sample size of enterprises compared to the official survey. Despite these disparities, the consistency in findings between the two surveys underscores their collective ability to provide valuable insights into the state of China’s industrial sector, offering a comprehensive view of the country’s economic landscape.
AUD/USD Live Chart


