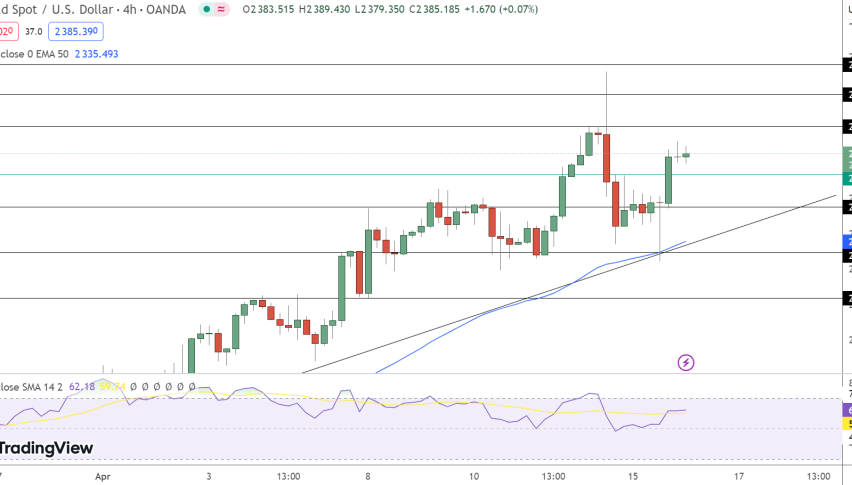
Gold forms support above 1961 as bulls attempt to regain last week losses


In the XAU/USD trading pair, gold’s price has been experiencing a downtrend since reaching its peak at $1987 on June 20. The bears pushed the price below the crucial level of $1960, eventually leading it to a weekly low of $1957, where it found support at the 10-period exponential moving average (EMA). During this period, the 100-day simple moving average (SMA) at $1961 has proven to be a significant demand level.
Currently, the price has managed to break above the 100-day SMA, indicating a potential shift in the market sentiment. The bulls are making an effort to establish a support level at $1970, aiming to retest the previous high set on June 20. However, there is still some uncertainty in the market, as reflected by the neutral reading of 28.5 on the Awesome Oscillator.
FED interest rates and CPI
The market sentiment is influenced by the Federal Reserve’s actions regarding interest rates. The core Consumer Price Index (CPI) has remained persistently high due in part to strong consumer spending, leading the Fed to consider raising interest rates to the range of 5.25-5.50%. This prospect has contributed to the divergent views between Fed officials and investors. While the Fed signals two more interest-rate hikes, investors expect that the upcoming increase will likely be the final one for the year.
As of now, the price is trading at $1965, slightly above the 100-day SMA, which may suggest a bullish bias. However, it’s essential to approach the market cautiously, considering the potential impact of future interest-rate decisions by the Federal Reserve. Such decisions could introduce volatility into the market and affect the overall sentiment. Traders should closely monitor price action, market sentiment, and key technical levels before making any trading decisions.
The various indicators and oscillators further support the notion of a potential bullish trend. With 15 buy signals, 10 neutral signals, and only one sell signal from the indicators, as well as two buy signals and no sell signals from the oscillators, the overall sentiment seems to lean towards the bullish side.

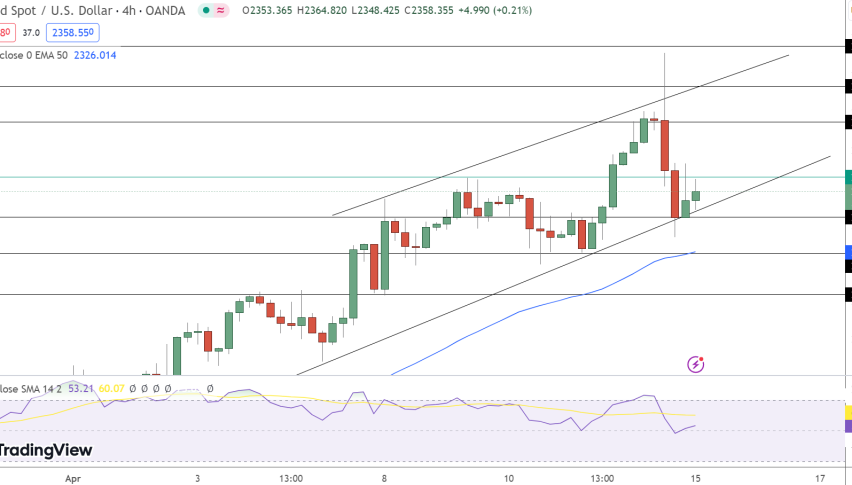
3-day chart XAU/USD price history
Gold price has been fluctuating within a narrow range following a three-day correction from its recent high of $1,984.00. Analysts anticipate a mean-reversion in the precious metal, with expectations for it to move towards the 20-period Exponential Moving Average (EMA) situated around $1,950.00. This means that the price is likely to gravitate back to this average as a potential support level.
The current performance of gold is influenced by the US Dollar Index, which has experienced a decent recovery. As the value of the US Dollar strengthens, it exerts downward pressure on gold prices. This inverse relationship between the US Dollar and gold is a key factor affecting the yellow metal’s price movements.
Traders and investors are closely monitoring these developments to make informed decisions in the market. The volatility within the narrow range suggests a period of uncertainty and indecision among market participants, waiting for clearer signals before establishing new positions. The 20-period EMA acts as a critical level to watch as it could provide insight into the short-term direction of gold’s price action.