The Bullish Trend Seems Over for AUD/USD, After the 20 MSA Gets Broken


The AUD/USD was the most bullish pair during the first few months after the big reversal in March. China which is a major export partner for Australia was recovering well, which improved the sentiment for the Aussie. Although the upside momentum slowed down, it continued until September 1.
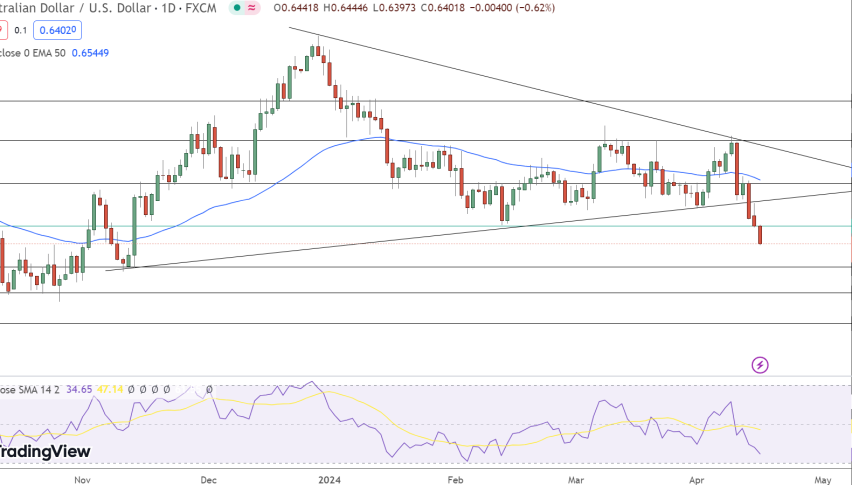
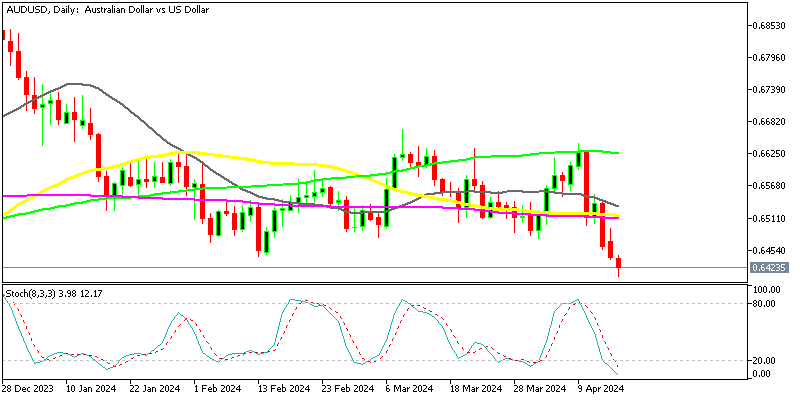
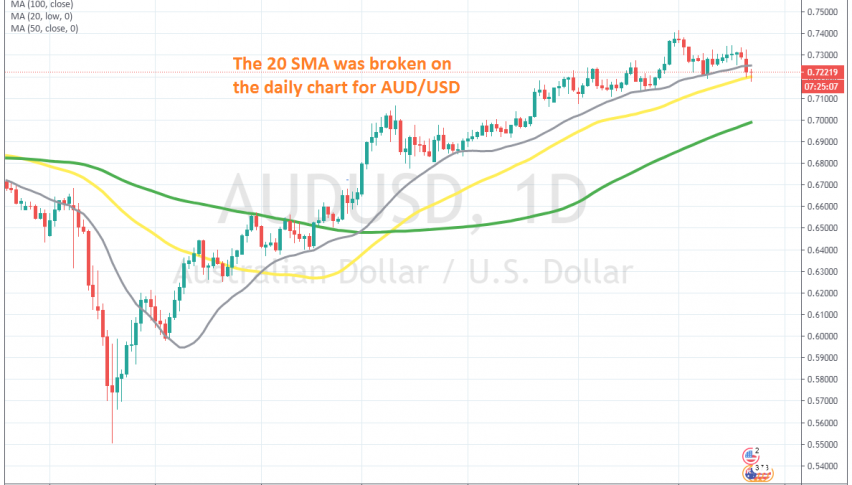
During the uptrend, the 20 SMA (gray) was doing a great job as support on the H4 chart, holding on retraces and pushing the price higher for the AUD/USD. The price formed a doji/pin candlestick at 0.74, both of which are reversing signals after the bullish trend.
The reversal took place, but the 20 SMA held as support again, although, that moving average was broken on Monday, as the USD turned bullish in the afternoon, which means that the bullish trend from back in March is over. Although, the 50 SMA (yellow) is holding the price now, I don’t think that the 50 SMA will last long. Now, we will be looking to sell the AUD/USD at the 20 SMA, if the price bounces off the 50 SMA.