Trading Course
Trading Course
Technical Forex Trading Strategies
- 1. Chapter 6 – Technical Forex Trading Strategies
- 2. Technical Analysis
- 3. Support and Resistance Levels
- 4. Price Action
- 5. Chart Patterns
- 6. Channels
- 7. Summary
Chapter 6 – Technical Forex Trading Strategies
It’s time to get right into the thick of things and start learning about technical analysis, one of the most common forex trading strategies. In Chapter 6 we will discuss some of the most popular forex trading strategies.
Technical Analysis
- Support and resistance levels
- Price action
- Chart patterns
- Channels
Technical analysis methods acquired huge popularity towards the end of the 20th century. The Internet revolution exposed millions of traders throughout the world to electronic online trading platforms. Traders of all types and levels began using tools and real-time analyses.
Technical tools collect every piece of information on past trends in an attempt to determine present and future trends. Price patterns point to the general activity of market forces. Technical tools work best on busy markets and sessions.
Technical analysis’s most significant advantage is the ability to identify entry and exit points. This indeed is high added value (which is the main reason that technical analysis is the most popular forex trading strategies). Most successful technical traders are those who base their trades on long term trends, but know when to listen to market forces at a given moment. Another important point is that most technical tools are very simple to use. Each trader can choose his favorite tools to work with. In the next lesson you will learn all there is to know about the most popular tools.
In order to get ready for the next lesson, you are now going to learn a number of techniques, terms and elementary aids for technical trading, so you had better pay attention!
Recommended Go back to Chapter 1 – Preparation to FX Leaders Trading Course and revise such topics like PSML and Basic Trading Terminology.
Support and Resistance Levels
Along a trend there are points that function as barriers that block the trend, until the price succeeds in breaking through them. Imagine actual gates which do not let anyone pass through as long as they are locked. Eventually someone will succeed in breaking them down or climbing over them. The same applies to price. It has a tough time breaking these barriers, called support and resistance levels.
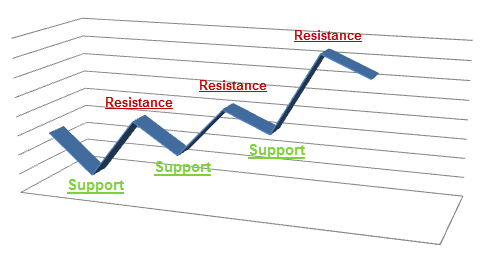
The lower barrier is called the Support Level. It appears as a final or temporary end of a bearish trend. It expresses sellers’ exhaustion, when they no longer succeed in reducing the price anymore. At this point, buying forces are stronger. It is the lowest point of a current downtrend on the charts.
The upper barrier is called the Resistance Level. It appears at the end of a bullish trend. Resistance level means that sellers are becoming stronger than buyers. At this point we are going to witness a trend reversal (Pullback). It is the highest point of a current uptrend on the charts.
Support and resistance levels are very useful tools to assist both beginners and experienced traders, for a number of reasons:
- Very easy to spot them because they are highly visible.
- They are covered continuously by the mass media. They are an integral part of the Forex jargon, making it very easy to obtain live updates on them, from news channels, experts and Forex sites, without having to be a professional trader.
- They are highly tangible. In other words, you do not have to imagine them or create them. They are very obvious points. In many cases they help determine where the current trend is heading.
Important: Support and Resistance levels are the strongest reasons for the “Flock Trade”: this is the self-fulfilling phenomenon whereby traders’ effectively create the market scenario they want. So when a potential point is about to appear on the chart, many speculative forces open or close positions, causing large price movements. .
Pay attention! If you are using Candlestick charts, shadows might also point to support and resistance levels (we are about to see an example).
Important: Resistances and supports are not exact points. You should think of them as areas. There are cases where the price drops above below the support level (which should indicate continuation of the downtrend), but shortly after it comes back, going up again. This phenomenon is called a Fake-out! Let’s see how support and resistance levels look on the charts:
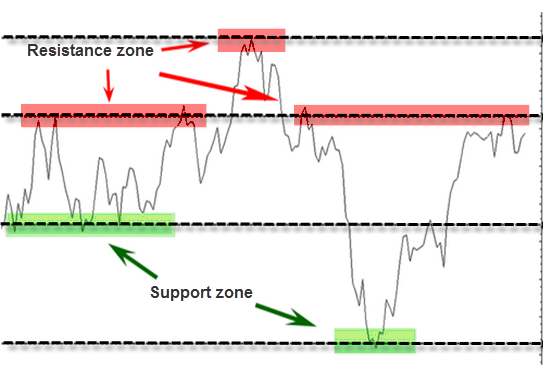
Our real challenge as professional traders is to determine which of the levels we can rely on and which ones we cannot. In other words, knowing which levels are solid enough to stay unbreakable for the time being and which ones are not that is a true art! There is no magic here and we are not Harry Potter. It requires lots of experience, plus use of other technical tools. However, support and resistance levels work at a relatively high probability, especially solid levels that have been used as barriers at least 2 times in a row.
Sometimes, even if the price has only been rejected once at some level, that level might turn into support/resistance. This usually takes place on longer timeframe charts or near round numbers like 100 in USD/JPY or 1.10 in EUR/USD. But, the more times the price gets rejected at one level the stronger that level becomes.
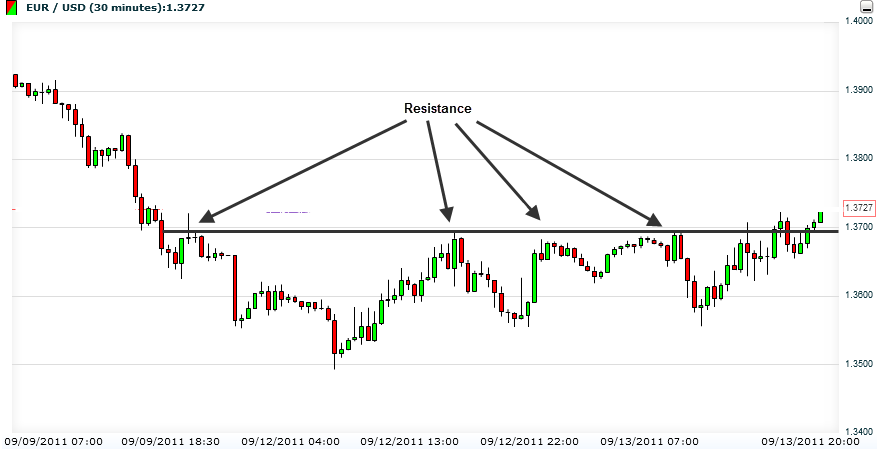
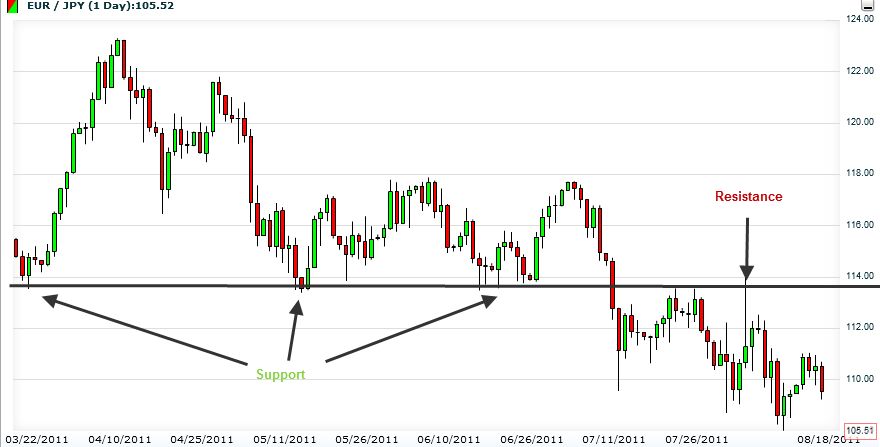
In many cases, once broken, a support level turns into a resistance level and vice versa. See the next chart: after using a Resistance Level 3 times (notice that on the third time it blocks long shadows), the red line eventually breaks and turns into a support level.
Important: When the price hits the support/resistance level, it is advisable to wait for more than just one stick to appear (wait until there are at least 2 sticks in the sensitive zone). It will strengthen your confidence while helping to determine where the trend is going.
Once again, the challenge is guessing when to buy or sell. It is difficult to decide on the next support/resistance level, and to decide on where a trend ends. Therefore, it is very hard to be sure when to open or close a position.
Tip: One good way to cope with tough situations like these is to count backwards 30 bars, next, locate the lowest bar out of the 30 and treat it as Support.
In conclusion, you are going to use this tool so many times in the future. It fits together perfectly with other indicators, which you will be learning about later on.
Breakouts are situations when support and resistance levels are broken by the price! Breakouts can have several causes, for example, a news release, changing momentum or expectations. The important thing for you is to try to recognize them in time and plan your moves accordingly.
Remember: There are 2 behavior options when breakouts occur:
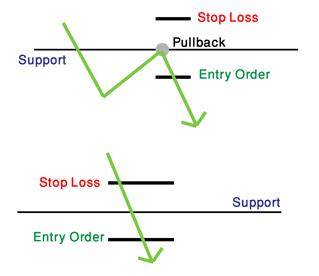
- Conservative – Wait a bit while price breaks level, until it reverse back to level. Right there is our signal to enter trade! This maneuver is called a Pullback
- Aggressive – Wait until price breaks level to execute a buying/selling order.
Breakouts represent changes in supply/demand ratios for currencies. There are Reversal and Continuation Breakouts.
The next graphs demonstrate breakouts on a forex chart in a clear, simple way:

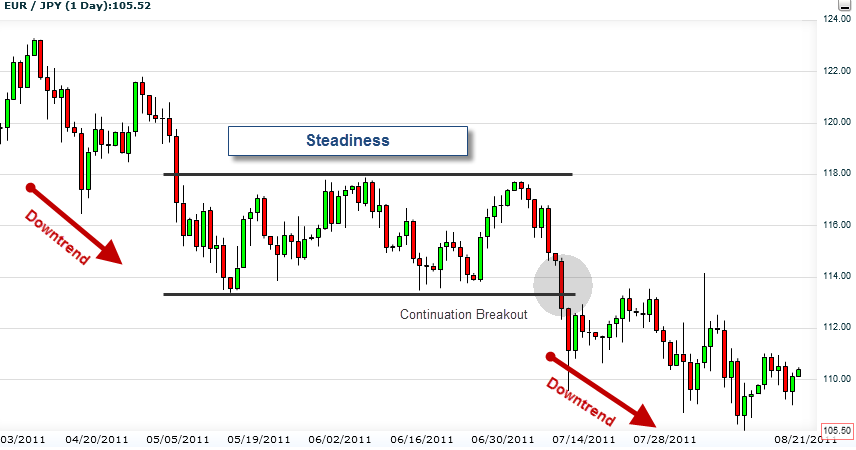
False Breakouts (Fake-outs): They are the ones to be careful of, because they make us believe in false trend directions!
Tip: The best way to use breakouts is to be a bit patient while price breaks level, in order to watch where the wind is blowing. If another peak on an uptrend (or a low on a downtrend) appears right after, we can reasonably guess that it is not a False Breakout.
In this chart we are using a Trend line Forex Trading Strategy:

You will notice the trend line breaks. Let’s wait a bit, in order to be sure that we are not witnessing a False Breakout. Check out the new peak (the second circle after breakout), which is lower than the breakout circle. This is exactly the signal we have been waiting for in order to open a bearish position!
- In the following chapters we will get back to this subject of support and resistance and explore it a little more, in order to understand how to use those points on a strategic level.
Price Action
You already figured out that prices change continuously. For years, technical analysts have tried to study the patterns behind market trends. Over those years, traders have improved technical methods that help them follow and predict changes, called trading the price action.
Important: At any given time, unexpected fundamental events might appear and break all the existing patterns on which we base our trades. Fundamentals can sometimes cast doubt on our technical analysis.
Commodities and stock indices are mostly affected by fundamentals. When fears of another global recession prevailed from 2014 to early 2016, the price of oil kept declining and the technical indicators were just small bumps along the way.
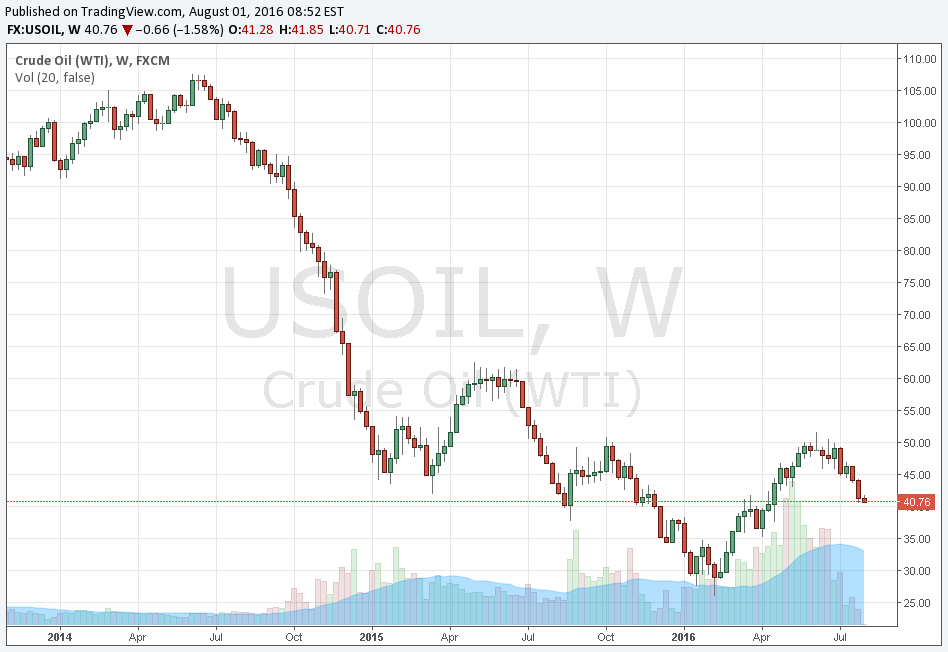
The same happened to the stock indices.
Take a look at the Nikkei 225; it went through all the moving averages and support levels like a knife through butter during the Chinese stock market crash in August 2015, and again in January and February 2016 amid global financial worries.
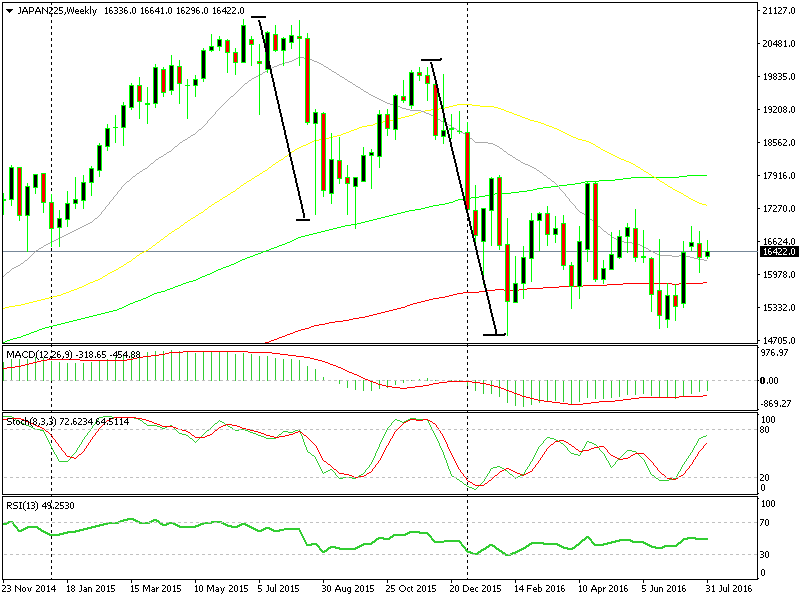
Because of the above, we recommend that you do not base all your trades on the following patterns, although they are still excellent tools for predictions.
Recognizing the patterns you are going to learn about would be very useful. Sometimes a trend will progress exactly according to pattern. As simple as that…
Wouldn’t it be amazing if we could figure how a price is going to behave at any given time?? Well, forget it! We do not have any miracle solutions. We still have not found the tool that predicts market trends 100% (unfortunately)… But the good news is that we are going to introduce you to a box full of helpful patterns. These patterns are going to serve you as great analytical tools for price movements.
Experienced traders follow trend directions, as well as their strength and timing! For instance, even in case you guessed right that a bullish trend is about to appear, you should figure out where to enter, so you do not make mistakes. Patterns are very important in these cases.
Chart Patterns
This method relies on the assumption that the market usually repeats patterns. The method is based on studying past and current trends to forecast future trends. A good pattern is like a sensor. Our sensors also forecast whether a trend will extend or make a U-turn.
Think of FC Barcelona’s scouts watching tapes of Real Madrid’s last games. Their analysis will discuss where threats will probably come from. Or if you do not like football, think of a military force protecting a village. They note that over the last few days hostile groups have been gathering north of the village. Chances of hostile attacks from the north are increasing.
Now, let’s focus on major forex patterns:
Double Top – Describes market conditions of mixed buying and selling forces. No group succeeds in becoming paramount. Both are situated in a battle of attrition, waiting for the other to break and give up. It concentrates on the peaks. Double top occurs when a price reaches the same peak twice but does not succeed in breaking through.

We shall enter when the price breaks the “Neckline” once again (on the right). You can even enter immediately but we advise that you wait for a pullback to the neckline again and the sell, because the first break might be a fakeout.
Now, check out the dramatic price fall which comes right after:
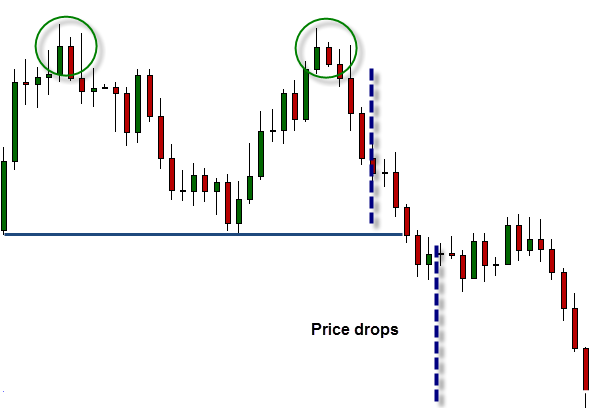
Tip: On many occasions, the size of decline will be more or less equal to the distance between peaks and neckline (as in the example above).
Double Bottom – Describes an opposite process. It emphasizes the lows.
Important: Double bottom usually appears within daily sessions. It is most relevant for intraday trading, when there is a flow of fundamental announcements that affect our pair. On many occasions we are dealing with triple or even quadruple tops/bottoms. In these cases we will have to wait patiently until a breakout appears, breaking the support/ resistance.
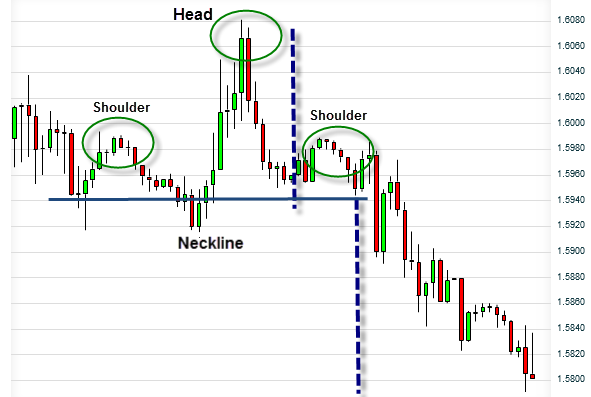
Head and Shoulders – The Head and Shoulders pattern informs us of a reversal on a “head”! Draw an imaginary line by connecting the 3 tops and you will get a head and shoulders structure. In this case, the best spot to enter a trade is just below the neckline. Also, as opposed to double top, here, in most cases the trend that follows the breakout would not be the same size as the gap between head and neckline. Watch the chart:
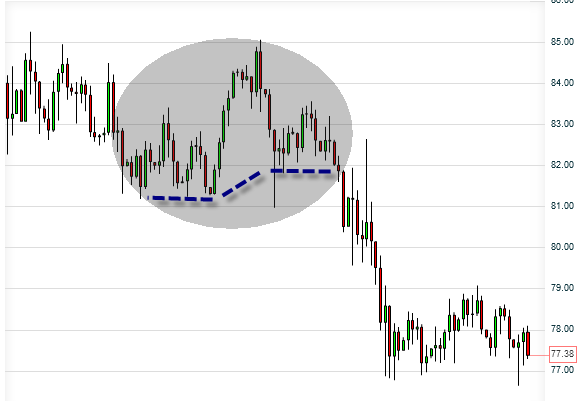
The next chart shows that we are not always going to get symmetrical Head and Shoulders pattern:
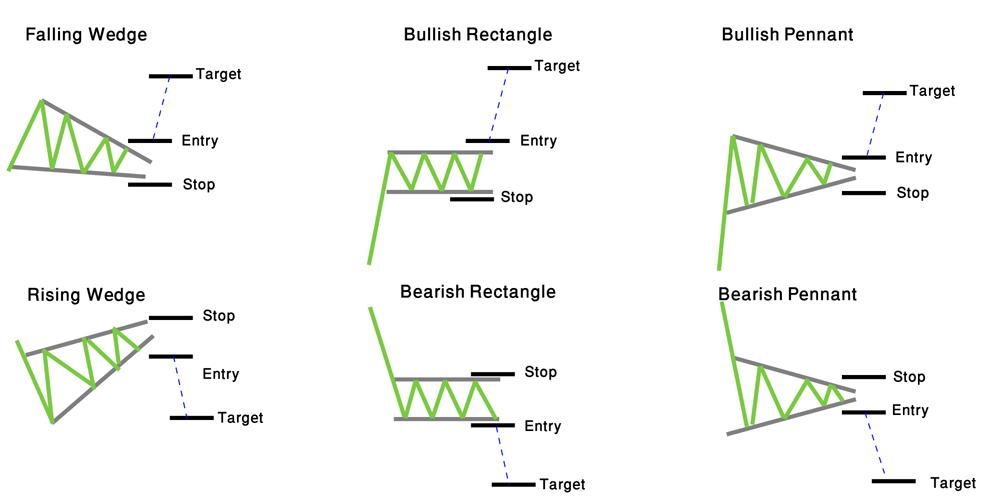
Wedges – The Wedges pattern knows how to diagnose and anticipate reversals and continuations. It works on both uptrends and downtrends. A wedge is built up of 2 non-parallel lines. These two lines create a non-symmetrical, cone-shaped channel.
In an up-going wedge (with its head up), the upper line connects the tops of the highest green bars (buys) along the uptrend. The lower line connects the bottoms of the lowest green bars along the uptrend.
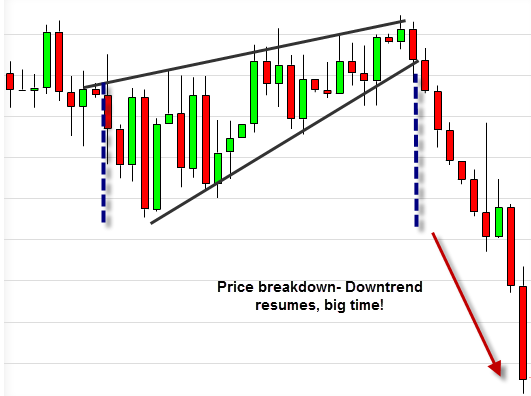
In a down-going wedge (with its head down), the lower line connects the bottoms of the lowest red bars (sells) along the uptrend. The upper line connects the tops of the highest red bars along the trend:

Entry points on wedges: we like to enter a few pips above the crossing of the two lines if it is an up-going trend and few pips below the crossing if it is a down-going trend.
In most cases, the following trend will be similar in size to the current one (inside the wedge).
Rectangles are created when price moves between two parallel Support and Resistance lines, meaning, in sideways trend. Our target is to wait until one of them breaks. That would inform us of a coming trend (we call it “think outside of the box”…). The following trend would be at least as high as the rectangle.
Let’s see a couple of examples of rectangle forex trading strategies:
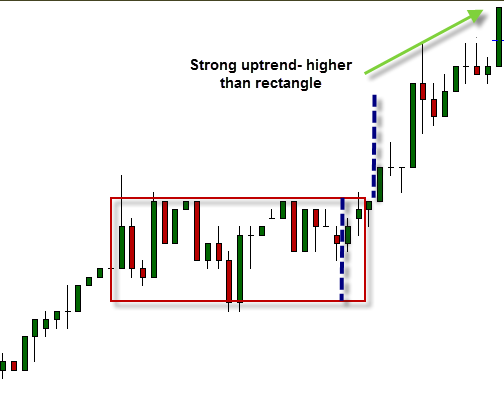
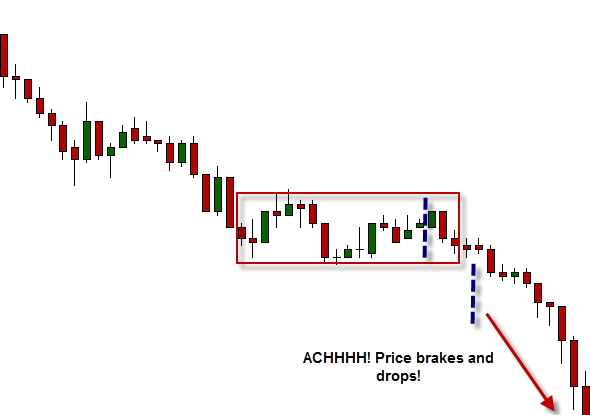
Entry point: Get ready to enter as soon as the rectangle breaks. We will take a small safety margin.
Pennants – A horizontal, symmetrical, narrow triangle-shaped pattern. Appears after large-scale trends. In most cases, the direction in which the triangle breaks forecasts a coming trend in that direction, at least as strong as the previous one.
Entry point: When the upper part breaks and the direction is bullish, we will open an order just above the triangle, and at the same time we will open a Stop Loss Order (remember Types of Orders in Lesson 2?) located a little below the lower side of the triangle (in case we are witnessing a Fakeout! In that case, the apparent breakout is trying to deceive us, followed by a sudden downtrend, against our predictions).
We act the contrary where the lower part of the triangle breaks and the direction is bearish:
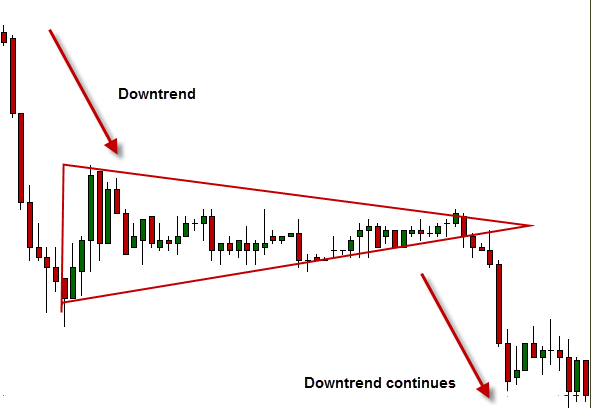
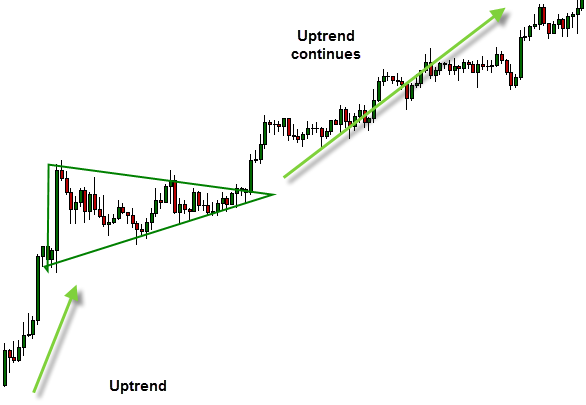
Triangles – There are 3 kinds of triangles: Symmetrical, Ascending and Descending. These patterns usually show up in an intraday trade, within short-term periods, when the market still has not decided on which direction the price is going.
Example of symmetrical triangle trading strategy:
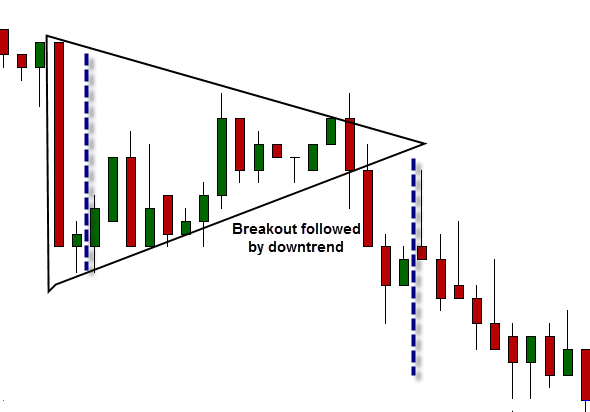
When recognizing a symmetrical triangle, you should prepare yourselves for an upcoming breakout that will point to the next trend’s direction.
Entry point: Not knowing the direction of the coming trend yet, we put set interferences on both sides of triangle, just before its vertex. Once having figured out where the trend is going, we immediately cancel the irrelevant entrance point. In the example above, the trend moves down. We cancel the entrance above the triangle in this case.
Another example of a triangle trading strategy:
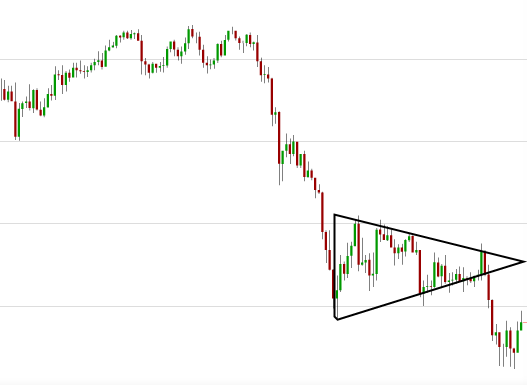
You can see that symmetrical triangles appear while the market is uncertain. The price inside the triangle ranges widely. Market forces wait for signs to signal the next trend’s direction (usually determined as a response to a fundamental event).
Ascending triangle forex trading strategy:
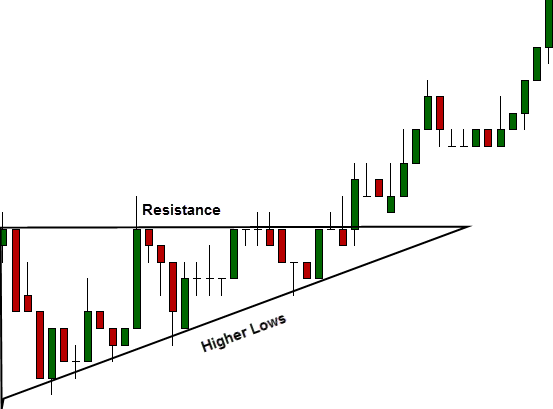
This patterns appears when buying forces are stronger than selling forces, but still not strong enough to break out of the triangle. In most cases the price will eventually succeed in breaking the resistance level and move up, but it is better to set entrance points on both sides of the resistance (next to the vertex) and cancel the lower one as soon as uptrend starts (we do this to reduce risk, because in some cases a downtrend comes after an ascending triangle).
Descending triangle forex trading strategy:
The descending triangle pattern appears when selling forces are stronger than buying forces, but still not strong enough to break out of the triangle. In most cases the price eventually will succeed in breaking the support level and move down. However, it is better to set entrance points on both sides of the support (next to the vertex) and cancel the higher one as soon as a downtrend starts (we do this to reduce risks, because in some cases an uptrend comes after an descending triangle).
Channels
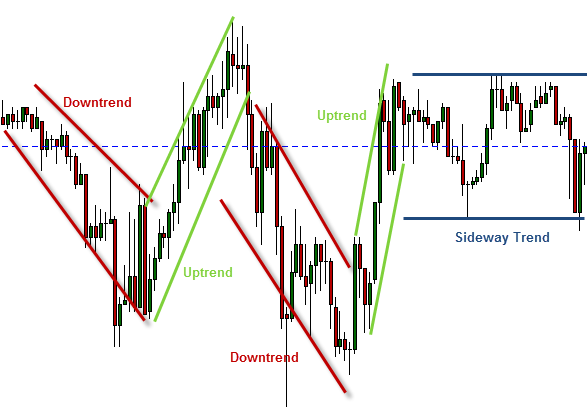
There is another technical tool that is also extremely simple and efficient! Most traders love using channels, mostly as secondary to technical indicators; In fact, a channel is built of lines parallel to the trend. They begin around the peaks and lows of a trend, providing us with good clues for buying and selling. There are three kinds of channels: Horizontal, Ascending and Descending.
Important: Lines must be parallel to the trend. Do not force your channel on the market!
Summary
Patterns that inform us about trend reversals are Doubles, Head and shoulders and Wedges.

Patterns that inform us about trend continuations are Pennants, Rectangles and Wedges.
Patterns that cannot predict a trend’s direction are Symmetrical Triangles.

Remember: Do not forget to set ‘Stop Losses‘. Also, set 2 entries if needed, and remember to cancel the irrelevant one!
So, what did we learn in this chapter? We went deeper into technical analysis, were introduced to support and resistance levels, and learned to use them. We also coped with Breakouts and Fakeouts. We have used channels and understood the meaning of price action. Finally, we studied the most popular and prominent chart patterns.
Can you feel your progress toward the target? Suddenly Forex trading does not seem that frightening, right?
Important: This lesson is essential to any of you who wish to trade like pros and become a Forex master. It is advised to go through it again briefly, to make sure you have got all the terms and information right, as it is impossible to turn into a professional trader without truly understanding the meaning and roles of Support and Resistance Levels!
It is time to switch to maximum energy! You have now completed more than half of our course, taking huge steps towards the target. Let’s conquer our objective!
The next chapter you will equip you with various technical indicators for your toolbox for Forex technical trading strategies.
Practice
Go to your demo account. Now, let’s do general revision on what you have learned:
- Choose a pair and go to its chart. Identify support and resistance levels along the trend. Distinguish between weaker trends (2 lows or 2 peaks) and stronger ones (3 rehearsals or more)
- Spot support levels that turned into resistance levels; and resistances which turned into supports.
- Try to identify Pullbacks
- Draw channels along a given trend, according to the rules you have learned. Get a feeling on how it communicates a trend.
- Try to spot a few of the patterns that you have learned
- Try to spot fake-outs and think how you can avoid them
Questions
- In many cases, once broken, support levels turn into??? (And vice versa).
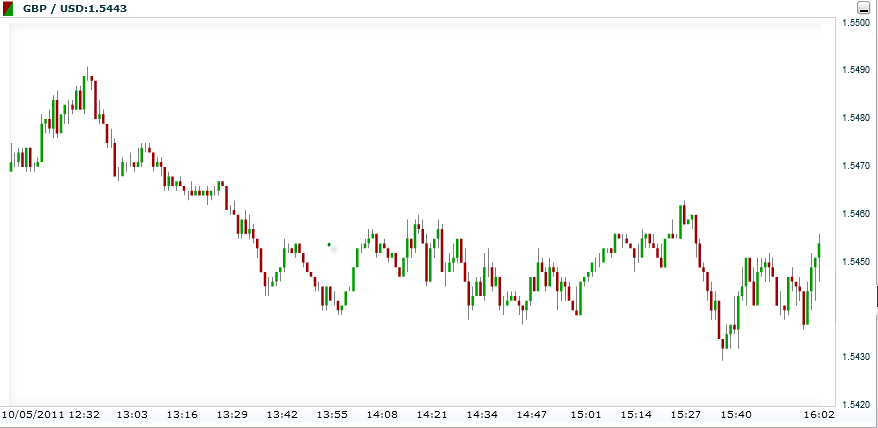
- Draw support and resistance levels on the following chart:
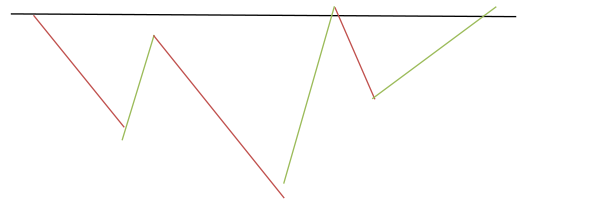
- How is the following pattern called? What is the red line called? What would your response be right now? What do you think is going to happen next to the price?
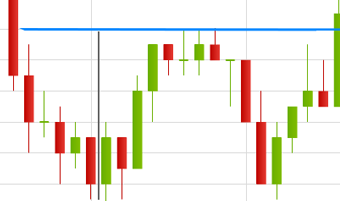
- What is the following pattern called? Why? What do you think is going to happen to the price?
- What is the following pattern called? What direction will the price take next after the breakout?
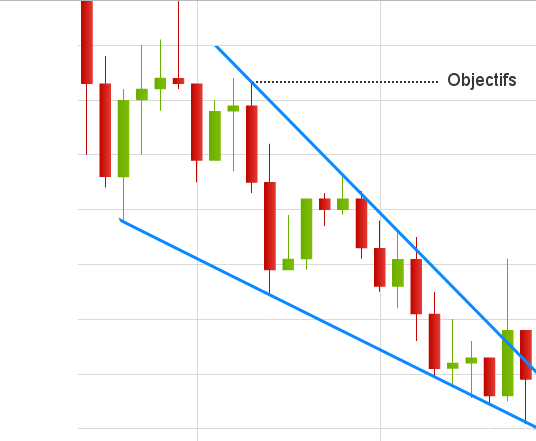
- Summary table: Complete the missing windows
| Chart Pattern | Appears during | Type of Alert | Next |
| Head and Shoulders | Uptrend | Down | |
| Inverse Head and Shoulders | Reversal | ||
| Double Top | Uptrend | Reversal | |
| Double Bottom | Up | ||
| Rising Wedge | Downtrend | down | |
| Rising Wedge | Uptrend | down | |
| Falling Wedge | Uptrend | Continuation | Up |
| Falling Wedge | Downtrend | ||
| Bullish Rectangle | Continuation | Up | |
| Bearish Pennant | Downtrend | Continuation |
Answers
- Resistance level (and vice versa)

- Head and Shoulders; Neckline; Trend will break out of the neckline, moving up; we would enter right after the price breaks neckline
- Double Top
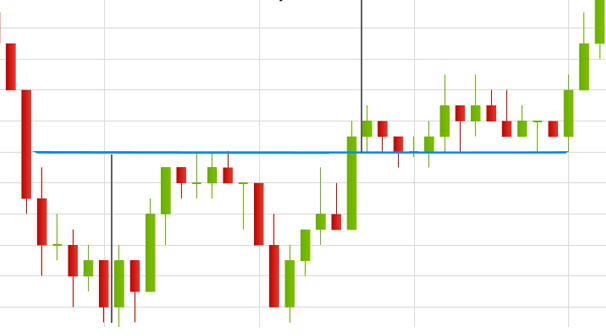
- Falling Wedge; Reversal uptrend; it is in fact good timing to enter a trade
- See ‘summary’ (link higher up on page)
Let’s continue to Chapter 7 – The Fibonacci Technical Indicator, where we will explain in great detail one of the most used technical trading indicators, the Fibonacci Indicator.


